매트랩 그래프 제목, 축 이름들 줄 띄우기 방법 | plot 고급 편집2
함수를 그릴 때 나는 주로 매트랩을 사용한다.
그래서 그래프의 제목이나 축 이름 같은 것을 적을 때 줄 한 칸을 띄어서 줄 바꾸기를 해주고 싶을 때가 종종 있는데 아무리 찾아도 간편한 방법을 못찾겠다.
그나마 찾은 방법이 아예 문장을 변수에 지정하여 newline 명령을 이용하는 방법이다.
예시는 다음과 같으니 필요하면 참고해보길 바란다.
----------------
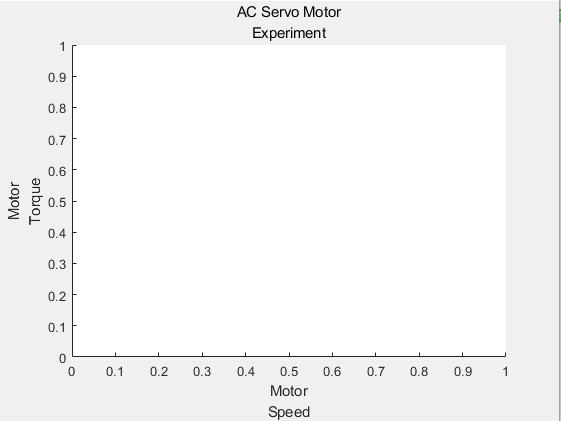
figure(1)
title(['AC Servo Motor' newline 'Experiment'])
마찬가지로 xlabel이나 ylabel에도 저런 식으로 넣어 축 이름도 줄 변경을 할 수 있다.
xlabel(['Motorstr_x' newline 'Speed'])
ylabel(['Motor' newline 'Torque'])
figure(1)
title(['AC Servo Motor' newline 'Experiment'])
xlabel(['Motorstr_x' newline 'Speed'])
ylabel(['Motor' newline 'Torque'])
     (adsbygoogle = window.adsbygoogle || []).push({});
+++
이글을 올리고 더 편한 방법을 발견하여 공유한다.
figure(1)
title({'AC Servo Motor','Experiment'})
xlabel({'Motorstr_x','Speed'})
ylabel({'Motor','Torque'})
figure(1)
title({'AC Servo Motor','Experiment'})
xlabel({'Motorstr_x','Speed'})
ylabel({'Motor','Torque'})
반응형
'유용한 지식 > 매트랩' 카테고리의 다른 글
| 매트랩 Powertrain Blockset과 Vehicle Dynamics Blockset을 이용한 차량 모델링 쉽게 따라하기1 | 프로젝트 설계 (1) | 2021.03.17 |
|---|---|
| 매트랩 Powertrain Blockset과 Vehicle Dynamics Blockset을 이용한 차량 모델링 쉽게 따라하기 (2) | 2021.03.17 |
| 매트랩 그래프 점 잇기 / 보간법 interpolation (0) | 2021.01.20 |
| 매트랩 수식 관련 함수 모음 (0) | 2020.08.10 |
| 매트랩 엑셀 데이터 불러오기 | xlsread 함수 (0) | 2020.08.05 |


댓글